
Irasshaimase! In part 2(a) of our Sushi Analysis, we proposed a possible accounting standard for DeFi protocols. The article was qualitative in nature, dissecting the different appendages of SushiSwap and how they ultimately tie in together in an accounting framework.
We were not quite satisfied with stopping there as it is easy to miss key details from a top-down approach. In this analysis, we went further down the rabbit hole, dumpster diving through all the information on Etherscan and the corners of the internet, Pepe Silvia style.

This exercise gave us a deeper understanding of the supply and demand dynamics of SUSHI as we uncovered two key factors that affected the price of SUSHI, the SushiBar, and its minting function.
We also read some tea leaves, plotted some numbers, did some Harry Potter magic to create a technical indicator for the trading junkies who enjoy reading price charts. Amidst the recent drama on crypto Twitter and in-fighting by the team, a blip flew under the radar…
Menu 2(b)
- SUSHI Supply Atlas – A Comprehensive Guide
- SUSHI Cookbook – A Step-by-Step Tutorial
- The Big Three
- There’s Something in the Water!
- Gochisousama!
SUSHI’s Supply Atlas, a Comprehensive Guide
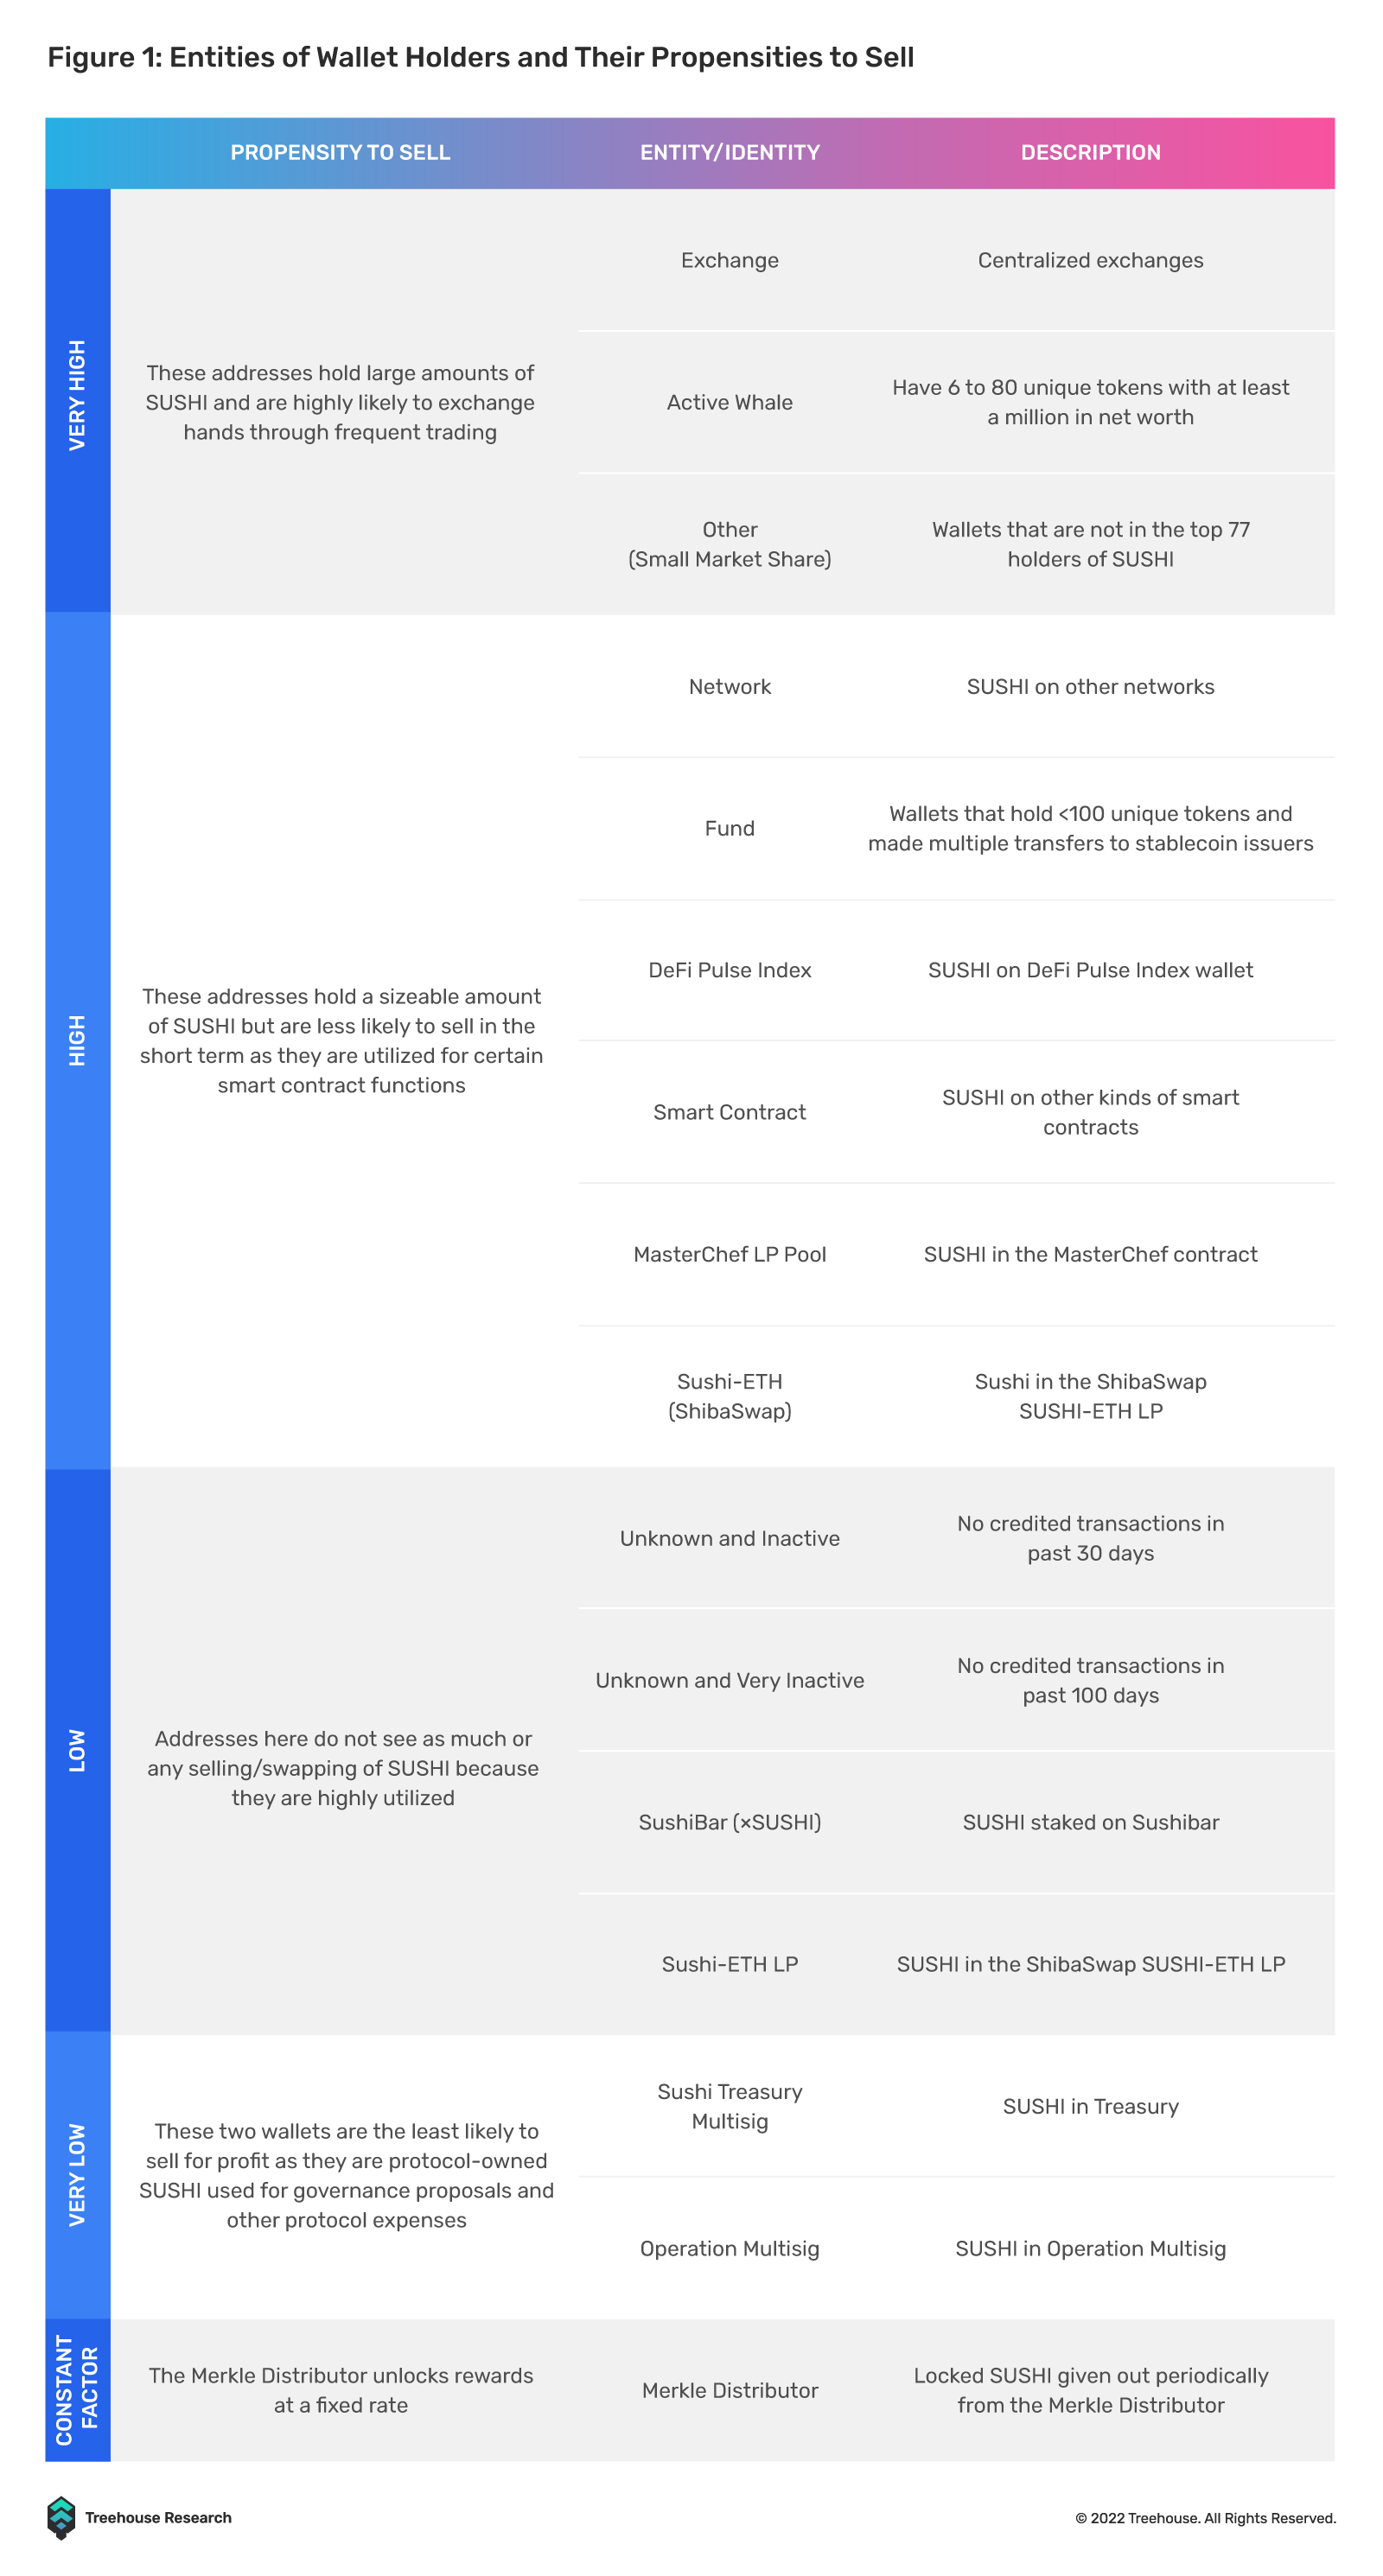
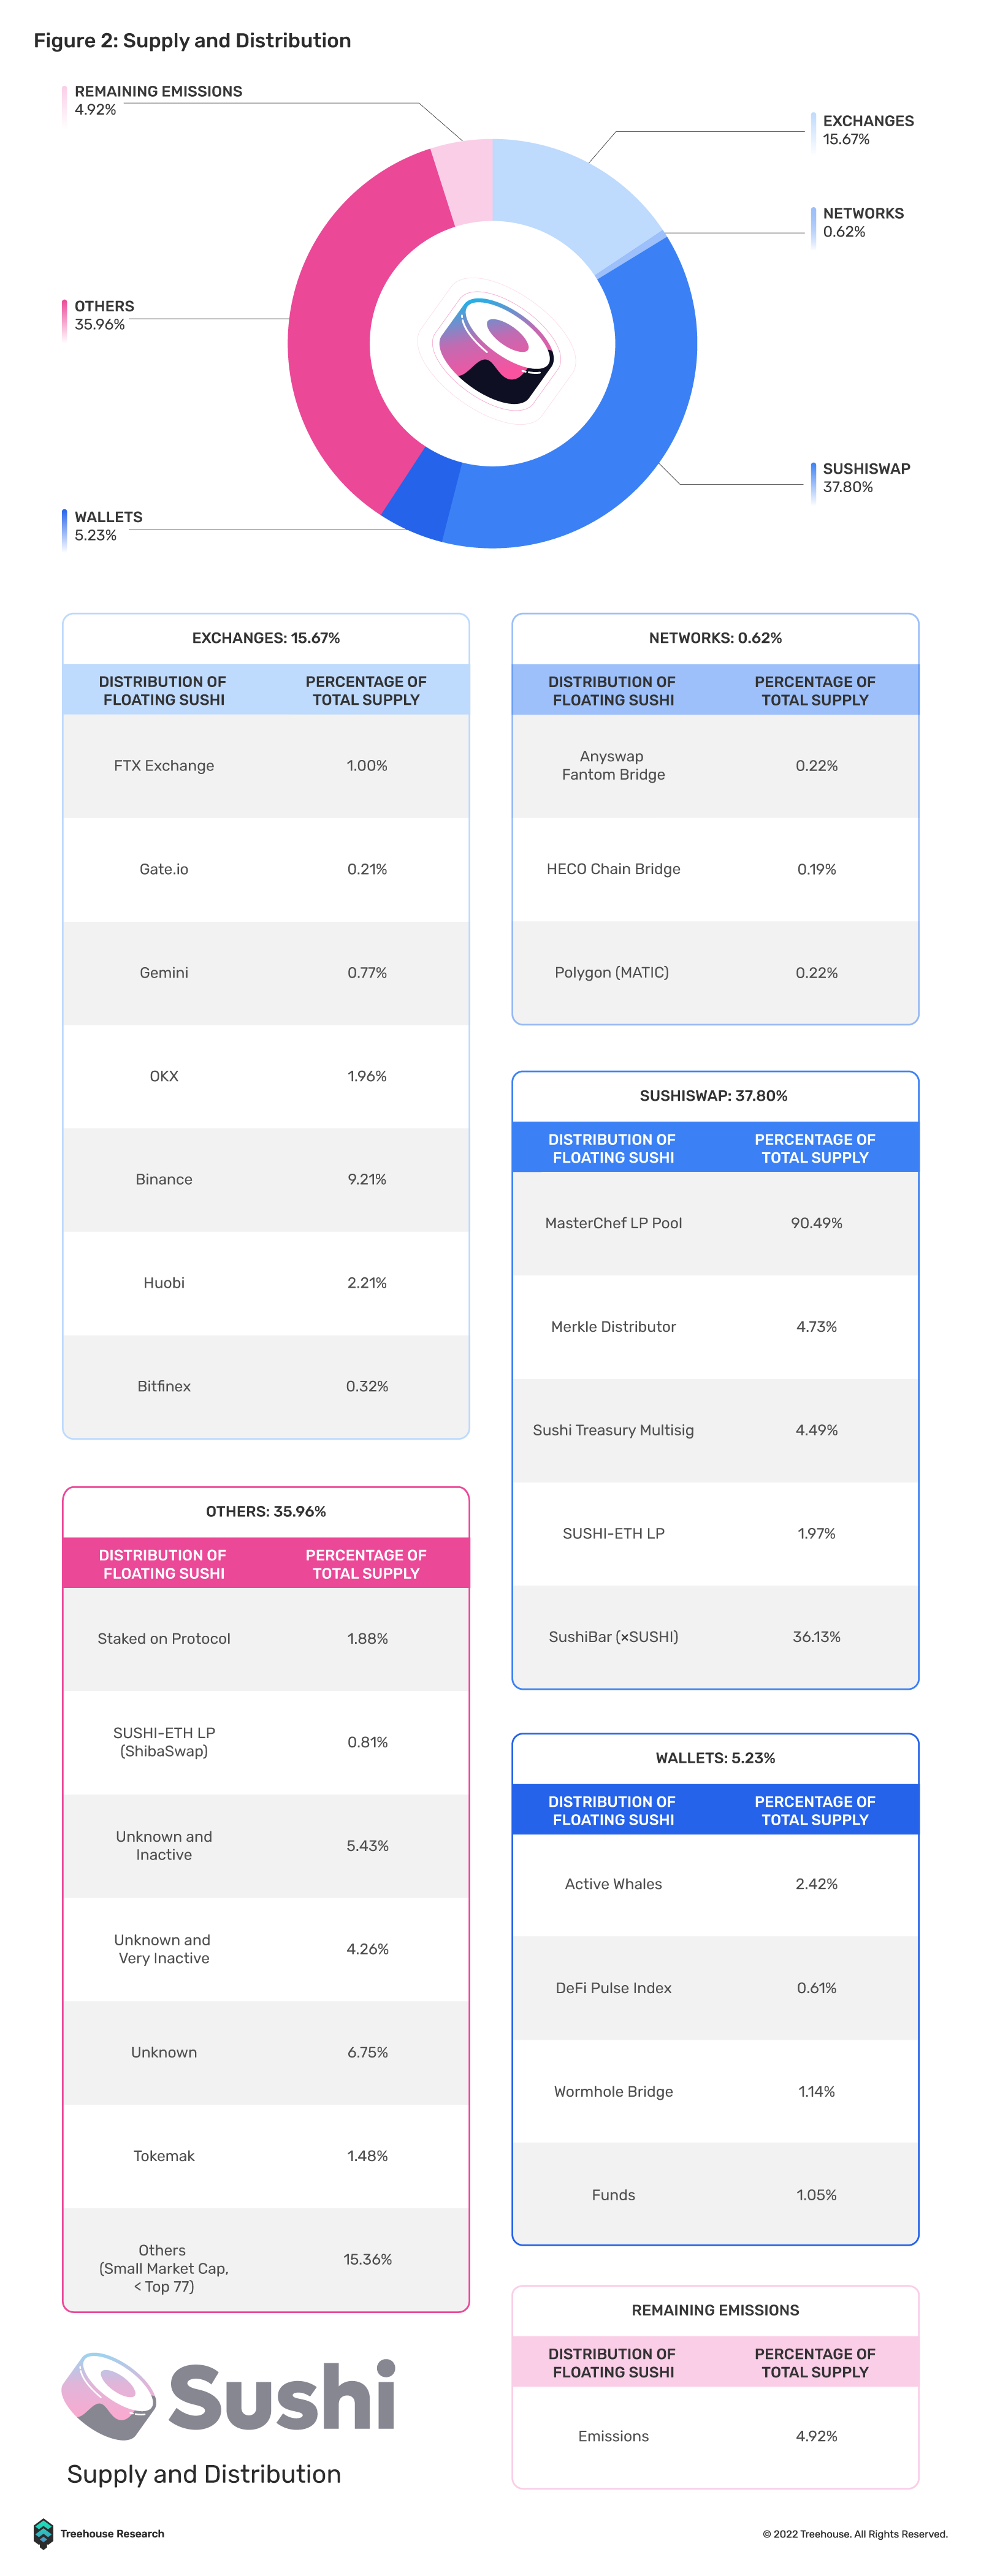
There are currently ~85,000 addresses that hodl SUSHI, and analyzing each and every one would take too much time. Lucky for us, the top 77 wallets collectively make up ~85% of the total SUSHI supply! Categorizing them should provide us enough coverage and insight on the protocol. Below, you may find our method to the madness!
SUSHI Cookbook: How to Make SUSHI
Now that we know the customers that SushiSwap is serving, it is important to know the minting dynamics of SUSHI to understand how the token is put into circulation.
New SUSHI is minted from the Masterchef LP contract which is a smart contract that is created to allow SushiSwap liquidity providers to stake their liquidity pool (LP) tokens. This is what many call rented liquidity, the project pays users in their native token to stay on the protocol and keep their liquidity there.
But what does “minted” mean? Do dwarves in a cave mine for shiny SUSHI tokens and put them online for sale? Sadly, no but here is a step-by-step recipe to create SUSHI.
Step 1: “Prepare rice with rice vinegar and mirin” – A user interacts with the Masterchef Contract via staking, unstaking, or claiming LP farming rewards.
Step 2: “Wrap rice with nori” – This interaction allows the Masterchef Contract to call the function to mint SUSHI from the Black Hole, 0x0000000000000000000000000000000000000000
Step 3: “Slice and serve with a side of soy sauce” – Of this SUSHI that is minted, 10% minted goes to SushiSwap’s Multi-Signature Treasury address, while 90% goes to the Masterchef Contract address to be claimed as rewards by the LP token stakers (LP farmers).
How does the smart contract know the amount of SUSHI to mint during the contract interaction? Well, the amount of SUSHI created is determined by two factors.
- The mint rate per block: how much SUSHI is to be minted per block.
- The number of blocks that has elapsed since the last contract interaction
Mix and multiply steps 1 and 2 until a smooth consistency to get the amount of SUSHI required from the minting.

Who decides the mint rate per block?
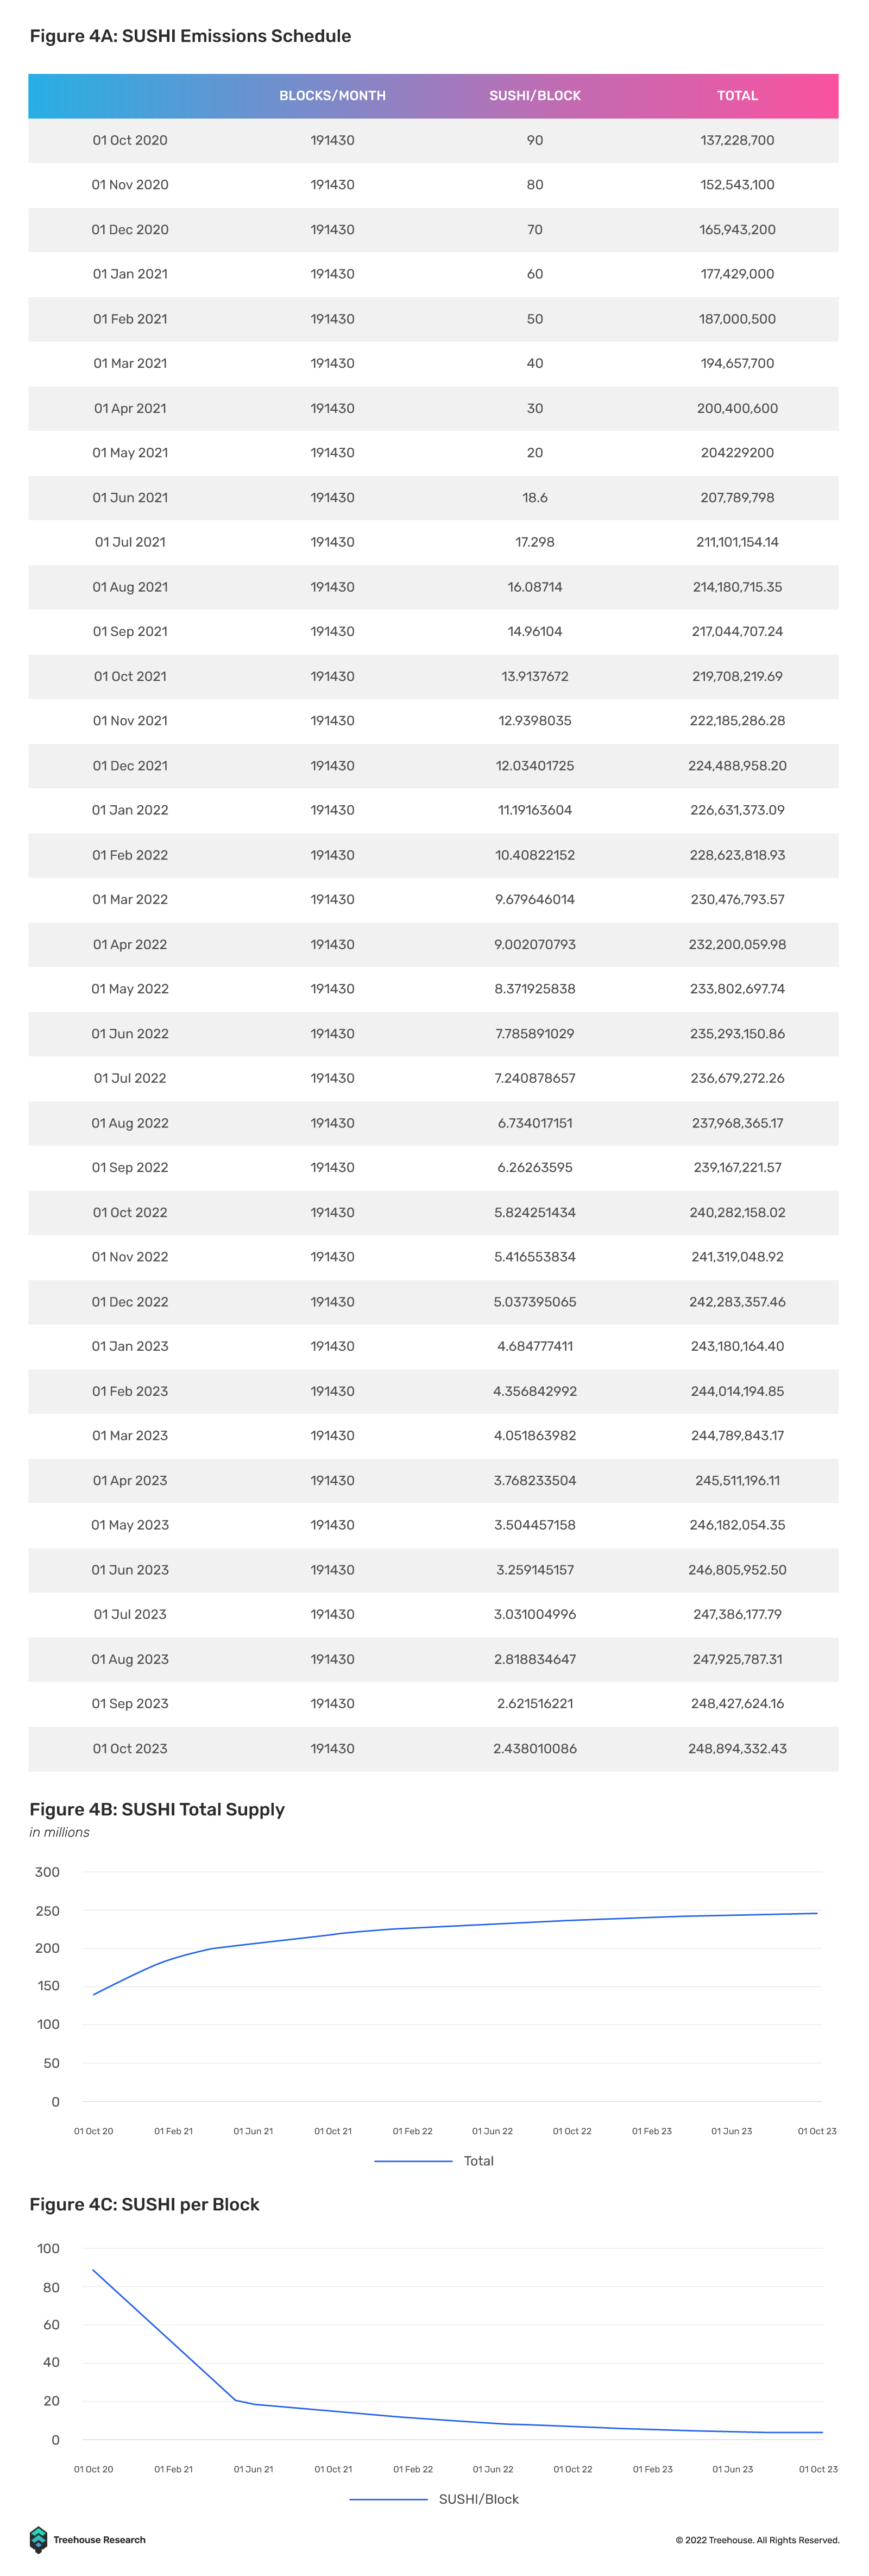
That was decided by the Sushi team, they detailed the “Sushinomics” of their token in their early documentation.
This table from the documentation shows the rate at which SUSHI rewards are minted. Starting at 90 SUSHI/block on 1 October 2020 and subsequently reducing each month until a rate of 2.438 SUSHI/block on 1 October 2023. After the last month, rewards are expected to end, where the SUSHI token supply will be capped at 250,000,000.
A substantial amount of information has been given about the types of SUSHI holders and where SUSHI is created. We could go through the historical data of each wallet but by the time you are done reading this report, Peter Schiff would have admitted that Bitcoin is a better store of value than gold. Instead, we wanted to focus on the top 3 entities that hold the most SUSHI because they are the most significant entities to the SushiSwap ecosystem.
The Big 3
1. The SushiBar
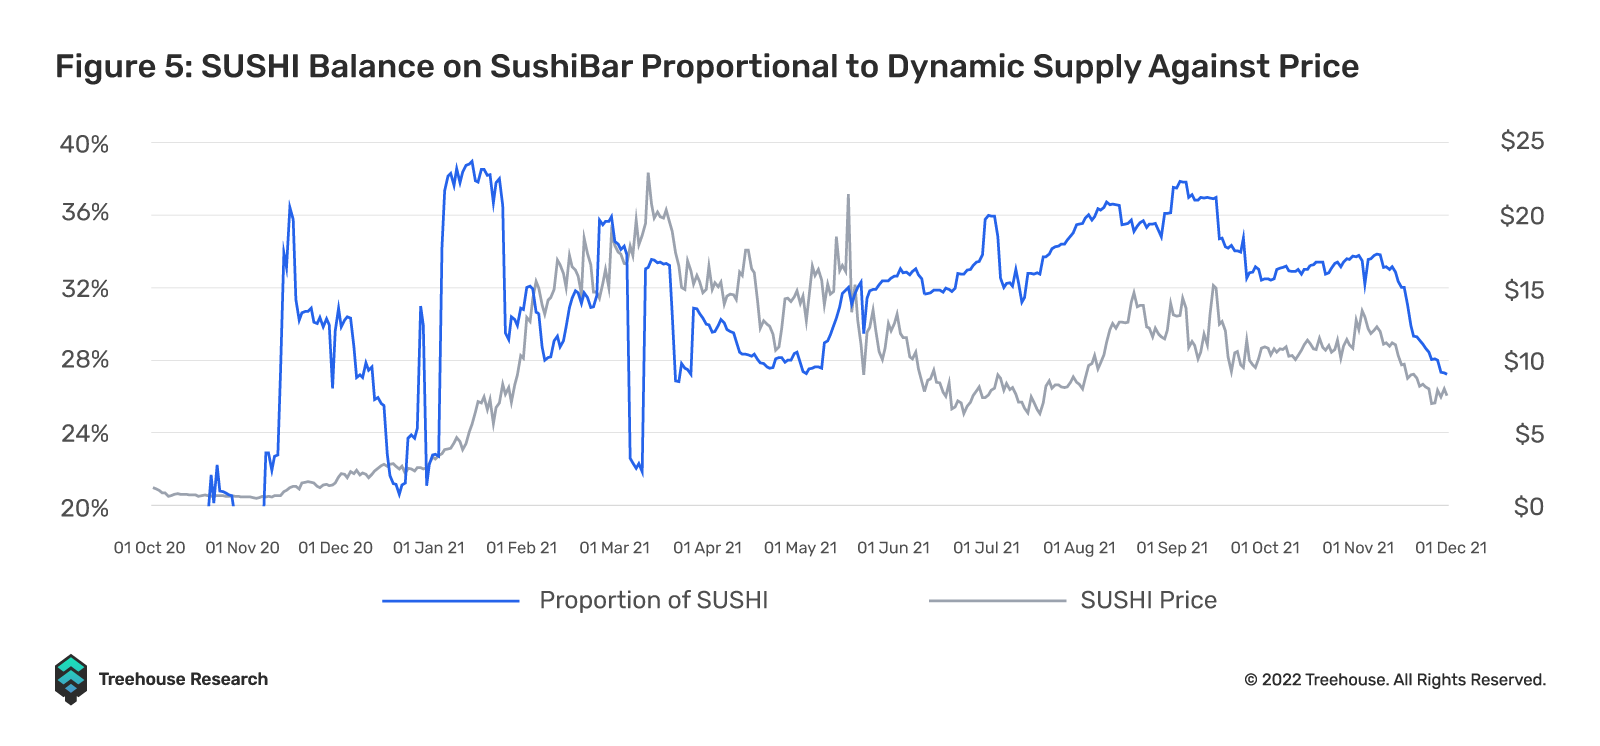
SUSHI’s utility comes from its staking on the SushiBar. As explained in part 2a of the analysis, a portion of fees generated from SushiSwap’s services is paid to SUSHI stakers. Users can buy SUSHI on the DEX to stake and enjoy that comfy passive rewards. This creates a feedback loop as more SUSHI is bought for staking, more fees are generated, SushiBar APY goes up, this attracts more investors to get into the SushiBar, and the loop repeats. As a result, there would also be more SUSHI locked up and less SUSHI in circulation thus increasing price.
TL;DR, Higher demand and lower supply, price go up.
The historical data reflects this trend; as the amount of staked SUSHI increases, the price increases and vice versa. The volatility seen in the first half of the graph is attributed to large deposits and withdrawals and a small initial circulating supply.
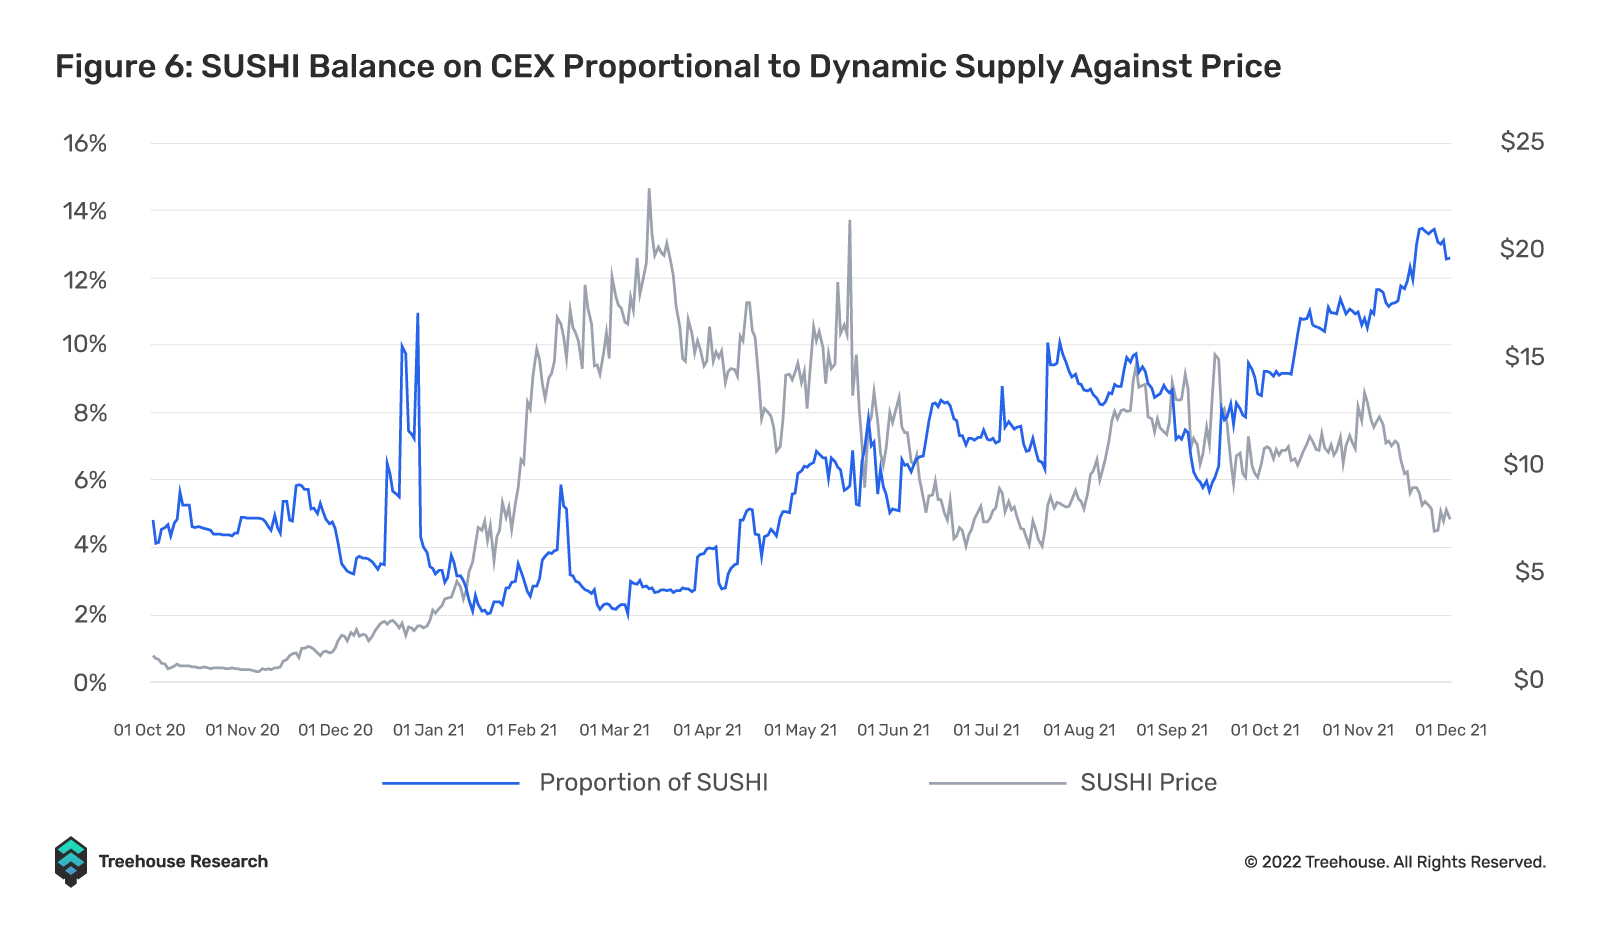
2. Centralized Exchanges
Profit realization mainly takes place on exchanges from crypto to fiat. This can be seen in BTC and ETH on-chain metrics where an increase in token balance on exchanges signals high selling pressure while falling token balance on exchanges signal high buying pressure. This trend is also apparent with SUSHI in recent months as it has matured and become less volatile.
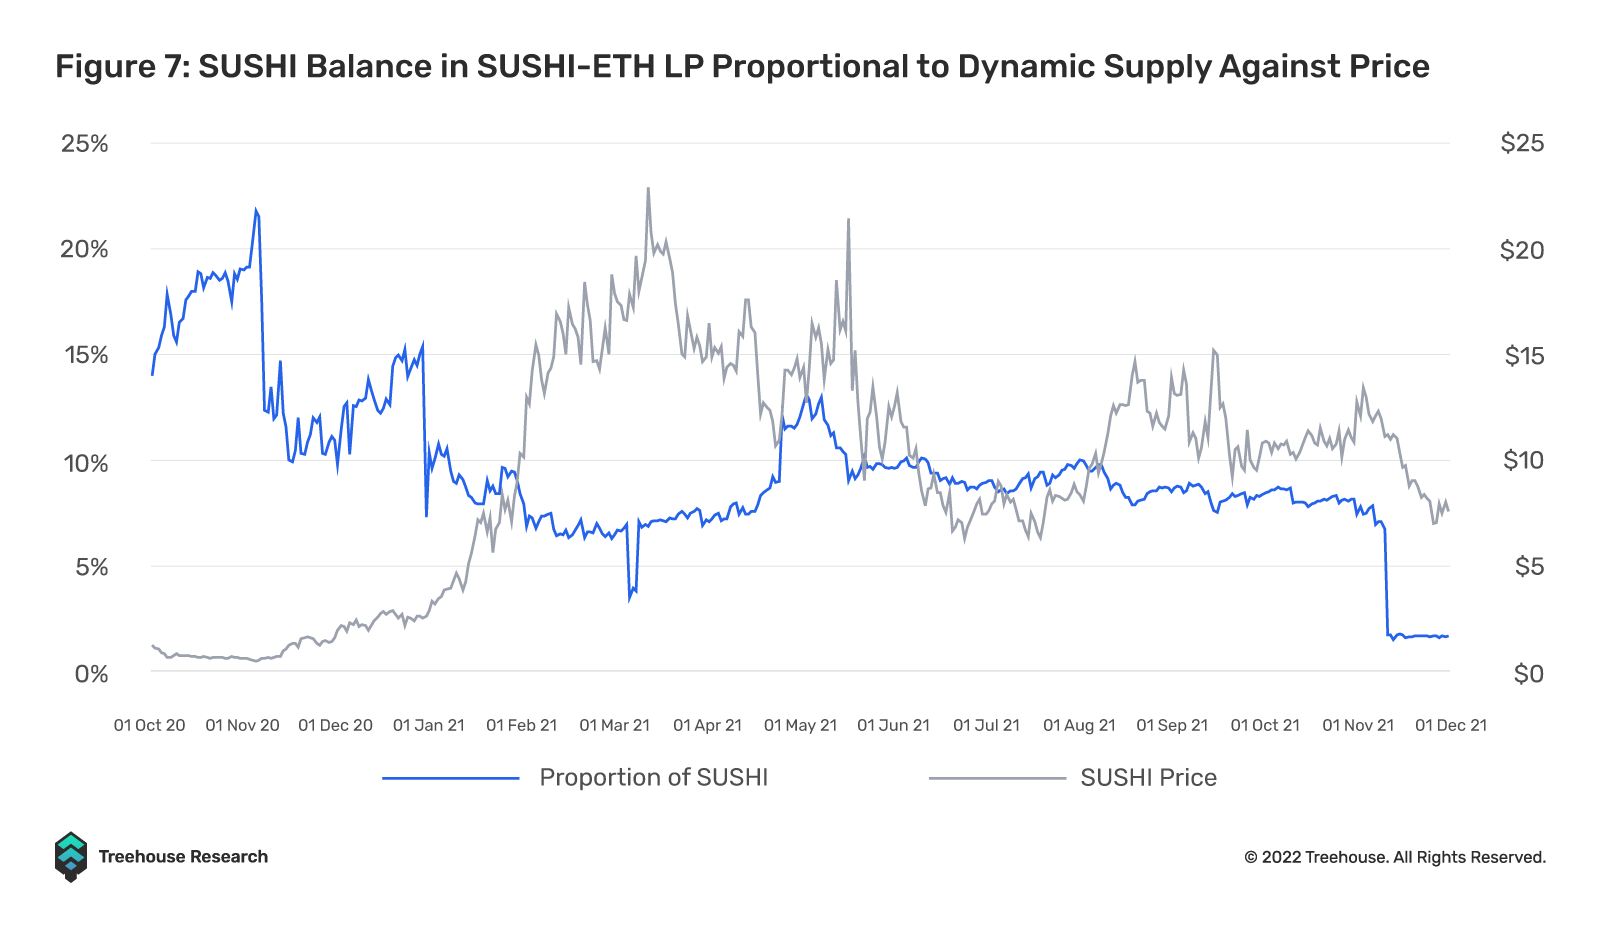
3. SUSHI-ETH LP
The SUSHI-ETH LP is where DeFi users can deposit equal amounts of SUSHI and ETH into a pool as liquidity for other users to trade against. When users want to buy more SUSHI they put ETH into the pool and get SUSHI in return. The balance of ETH in the pool increases while the balance of SUSHI decreases.
Understanding the balance of SUSHI in this pool is more nuanced as a fall in SUSHI in the pool can be both bearish and bullish. If sentiment is bullish, then the balance of SUSHI will fall as price rises. However, a bearish sentiment also shows a fall in SUSHI as liquidity providers reduce exposure to SUSHI by removing their liquidity. Both trends are depicted in the chart.
These three entities are just an aggregate of many wallets’ liquidity, they do not belong to any specific person. What about independent wallets that own a significant amount of SUSHI? What risks do these large individual stakeholders pose on the overall SUSHI market?
As mentioned at the start, we jumped down the rabbit hole and we meant it. We dug through each wallet’s token balance and transactions just to have a deeper understanding of how they behave. We left no stone unturned and managed to dig up a few interesting gems from the cold transaction-laden crypto wasteland.
There’s Something in the Water
Whales
In the animal kingdom of cryptocurrencies, the ones at the top of the food chain are the whales. These are the wallets that hold many different types of tokens and in huge amounts that are enough to shock the market if they were to dump all their tokens. Since it is impossible to prevent whales from dumping, the next best thing a potential investor could do is to find out the extent to which these whales can nuke markets.
For this analysis, whales were classified as those who held 6-80 different types of tokens and owned several NFTs, whose wallet net worths were in the millions (USD). Most of their transactions include claiming rewards and accumulating meme coins. 7 wallets made the cut, collectively holding 2.21% of the total SUSHI supply. In comparison, the rest of the wallets not in the top 77 (approximately 85,000 wallets) own 15.36%. The average amount of SUSHI per whale compared to the average amount of SUSHI per shrimp wallet is approximately ~1250:1. Based on SushiSwap’s interface, a total dump by whales of all their SUSHI holdings would result in a 65% price drop. The average amount of SUSHI dumped by one whale would result in a 21.3% price drop.
“Muddy Waters”
There were 39 other wallets we found that also held a large amount of SUSHI but did not fit the characteristics of whale wallets. These wallets held only SUSHI, in amounts of 500,000 – 1,000,000 that totaled 17.91% of all SUSHI. When we looked at these wallets in October, their last transactions 30-100 days ago involved transferring SUSHI tokens to themselves.
However, since then, these wallets have become active again, and now hold another coin besides SUSHI, a token called “SUSHI2.0 by 0xMaki”. So we kept pulling at the thread and found that something had been going on since the start of December, in the middle of the SushiSwap fiasco.
A wallet “0x2dE86Ca1dB1A8591b89e8a00914f61B576221C85” created the token “SUSHI2.0 by 0xMaki” on the 6th of December, which also sent a large amount of SUSHI2.0 tokens to 0xMaki. When looking at SUSHI2.0’s holders, 0xMaki currently owns ~98% of SUSHI2.0 tokens.
Bonus content: The contract creator wallet also bought an ENS domain in that same week of creating the token. Any guesses for what this ENS name might be? Yeah, “sushi2.eth”.….probably nothing.
With reference to the first point, we are not sure how these mysterious wallets relate and why they hold so much SUSHI and SUSHI2.0, but they seem to be holding without any intention to sell in the short term as they have not done anything with the SUSHI in there. However, making up 17.91% of all SUSHI in the ecosystem is nothing to ignore and it poses huge risk and uncertainty for other SUSHI holders.
Gochisousama!
If you have read this far then you are probably looking for some extra insights and it would be wrong for us not to show you what we have cooked up with the data we got.
With what we have dug up, we can set up metrics to measure the amount of SUSHI that is more likely to exchange hands and the amount of SUSHI that is being staked which would inadvertently affect price.
In other words, we have used the data of SUSHI being put into circulation (minted) and SUSHI staked to provide a technical indicator to reflect the demand and supply dynamics of SUSHI and its price.
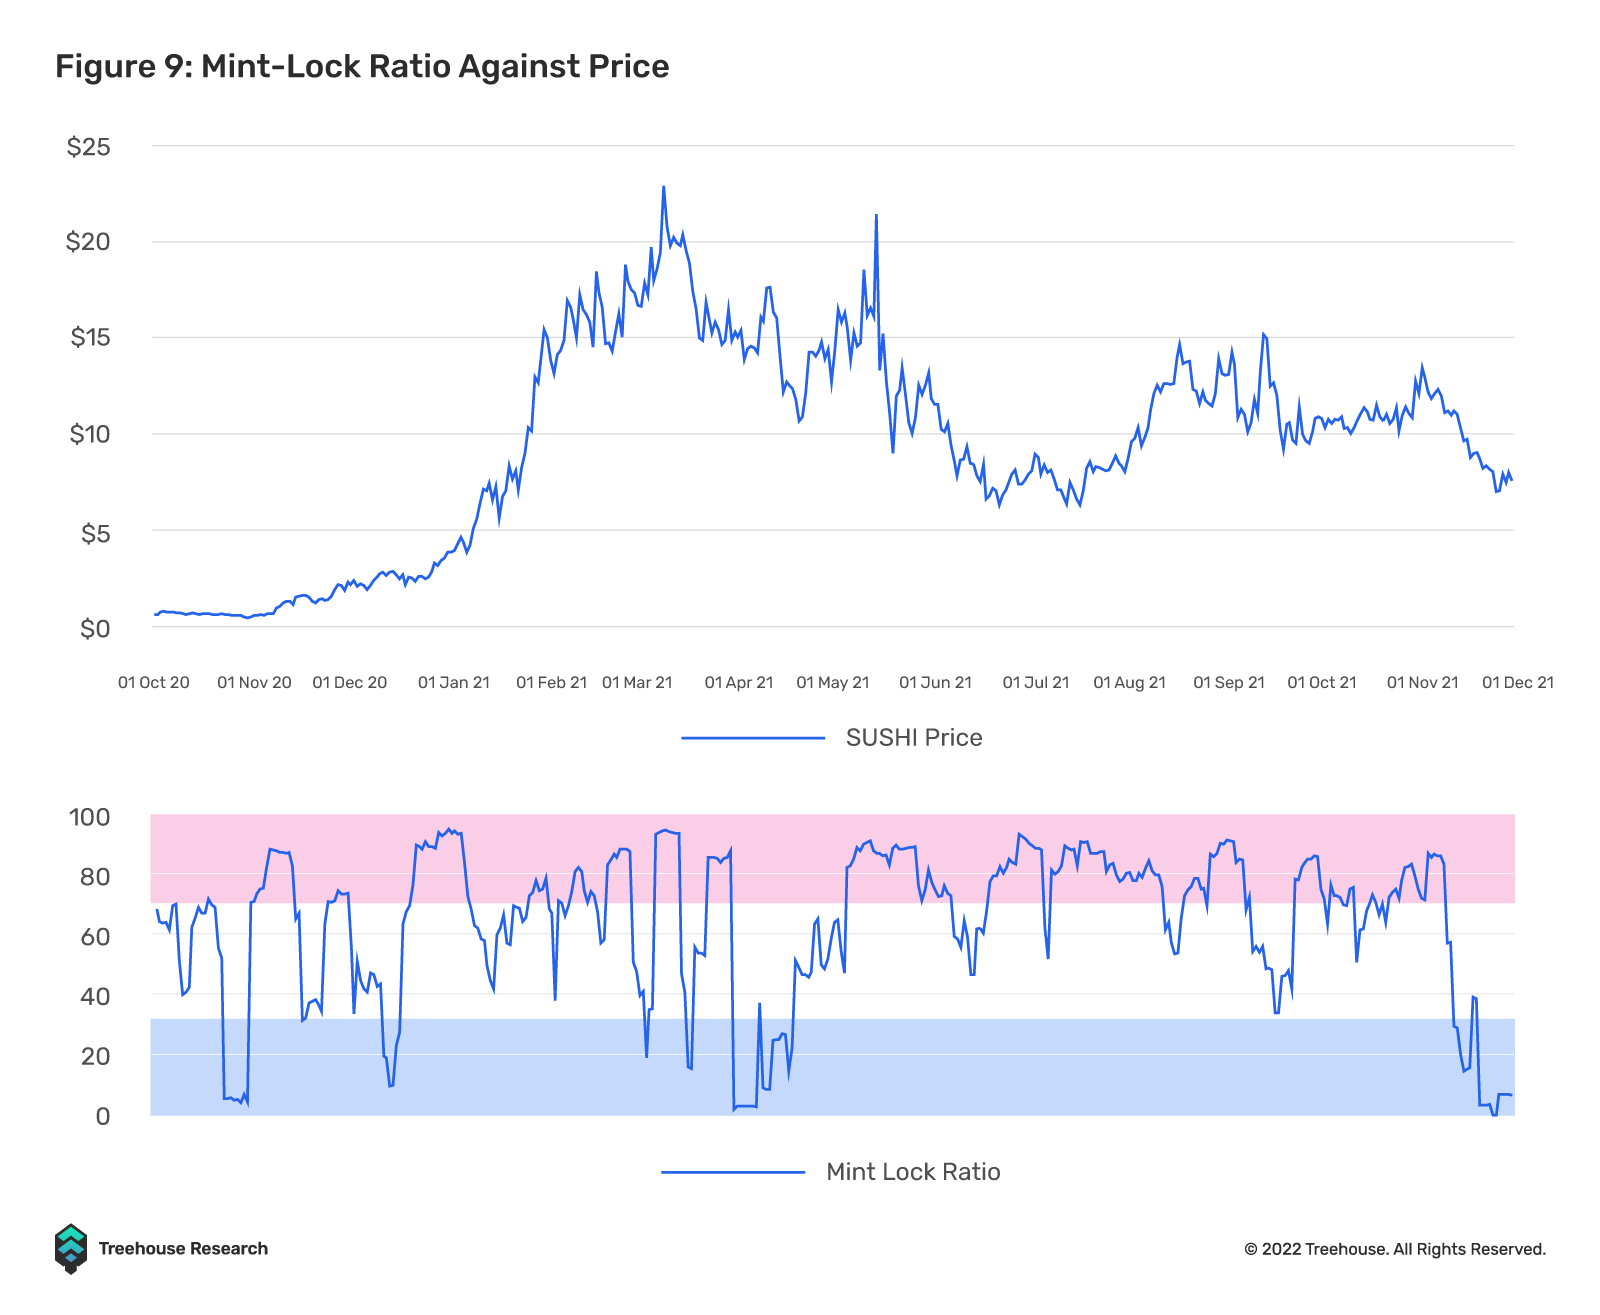
Introducing…. The Mint-Lock Index
This indicator adapts the Relative Strength Index (RSI) formula, which measures the relative strength of price given its average gains over a certain period and average losses over the same period. Instead of price gains, we use the amount of SUSHI staked on a 5-day average basis, and instead of losses, we use the same basis for SUSHI claimed as rewards (put into circulation).
This index indicates that more SUSHI staked vs. SUSHI put into circulation leads to bullish sentiment and higher prices, since there is higher demand and lower supply.
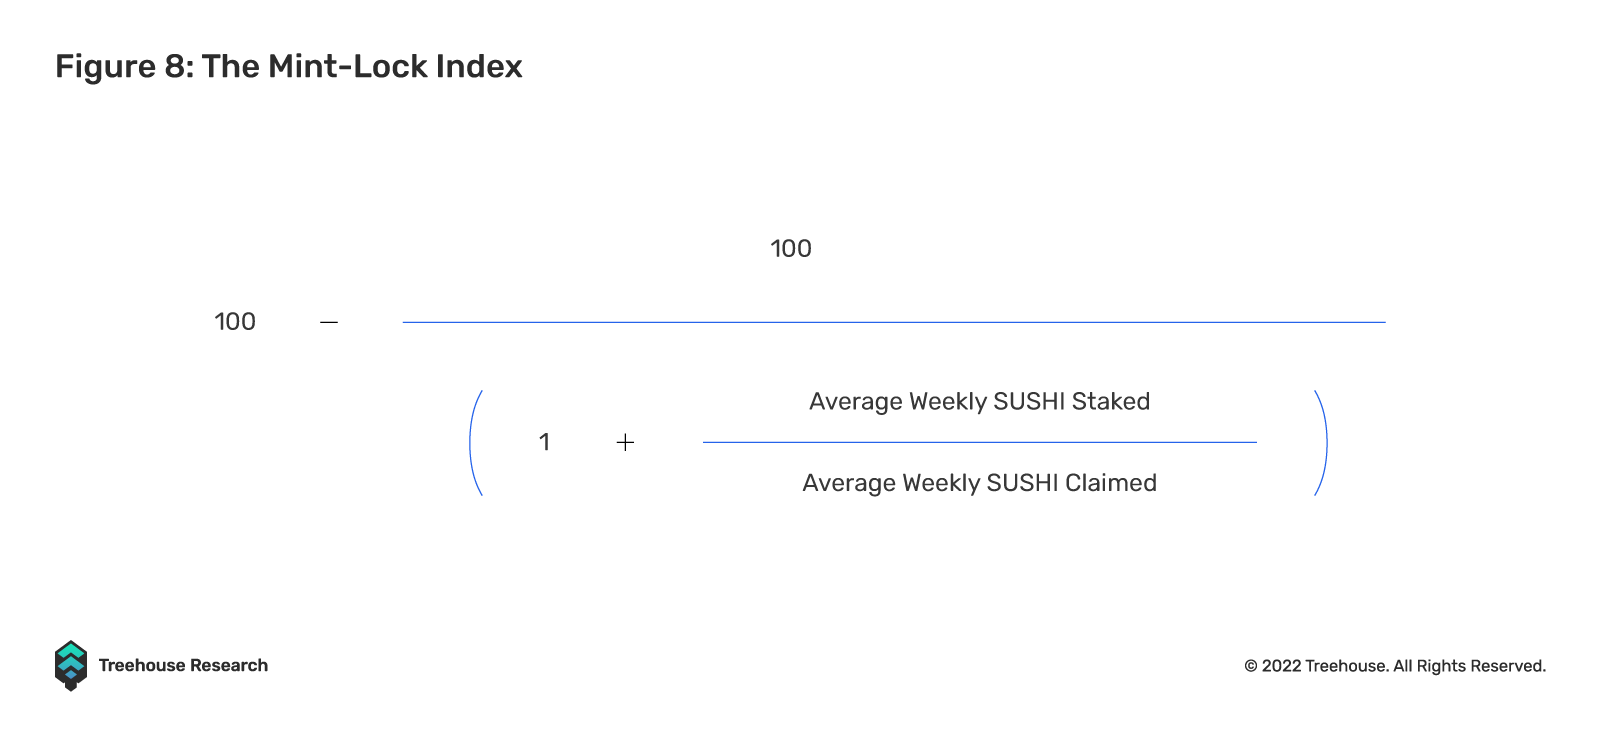
This indicator has an upper bound and lower bound of 100 and 0. Like the RSI indicator, moves to the 0 level indicate oversold conditions, and overbought conditions when it moves to the 100 level.
If you have skipped to the end (yes, you) to decide if this is worth reading, here is a summary. We dug through Etherscan, downloaded too many CSV files on SUSHI, queried multiple wallets on Dune Analytics, and played with some numbers to create an index for straight-men astrology technical analysis. If you have enjoyed this 4-course meal you would now know,
- How to make SUSHI
- SushiBar is a strong indicator/driver for SUSHI demand
- Centralized Exchange balances can indicate trader sentiment
- Whales are very very scary…
Footnotes:
1 Requirement to be considered a significant wallet: owning at least 0.1% of total SUSHI supply. Only 77 wallets made the cut.
2 This is the address where tokens are burnt and minted, it is called the Blackhole because that is the crypto void, it does not belong to any person.
3 (2.21%/7 whales)/(15.36%/85,000 wallets) ~ 1250
4 2.21%/7 Whales x 250,000,000 SUSHI = 789,285 SUSHI
5 It is also worth noting that some new wallets like these were created from the time we started investigating in October and now. Some of the older wallets transferred all their SUSHI into these new wallets.
Disclaimer
Treehouse holds SUSHI. This publication is provided for informational and entertainment purposes only. Nothing contained in this publication constitutes financial advice, trading advice, or any other advice, nor does it constitute an offer to buy or sell securities or any other assets or participate in any particular trading strategy. This publication does not take into account your personal investment objectives, financial situation, or needs. Treehouse does not warrant that the information provided in this publication is up to date or accurate.
Hyperion by Treehouse reimagines workflows for digital asset traders and investors looking for actionable market and portfolio data. Contact us if you are interested! Otherwise, check out Treehouse Academy, Insights, and Treehouse Daily for in-depth research.